NDVI
A simple system used to determine plant health using NDVI technology
Learning challenges: #
- Figuring out Vegetation index.
- Image processing.
- Interfacing Arduino Uno with raspberry pi.
Key skills built: #
- Raspberry pi programming.
- Arduino uno.
- Image processing.
- open cv.
What is NDVI? #
NDVI stands for Normalised Difference Vegetation Index, it always ranges form -1 to +1, it can help us determine healthy plants form unhelathy plants, other land covers (water, concrete, etc).
For example, when you have negative values, it’s highly likely that it’s water. On the other hand, if you have an NDVI value close to +1, there’s a high possibility that it’s dense green leaves.
But when NDVI is close to zero, there are likely no green leaves and it could even be an urbanized area.
Meaning of NDVI values.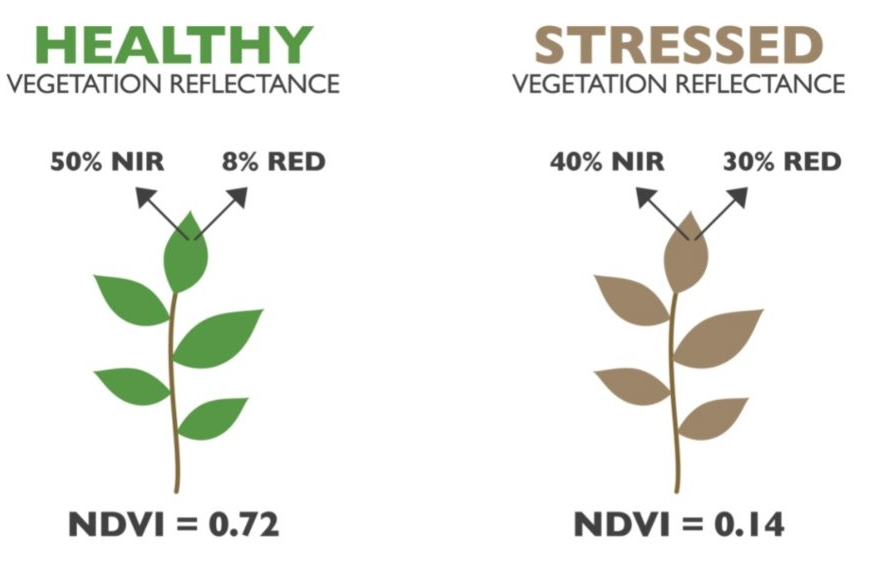
Plants do not prefer infrared radiation very much as it brings up their temperature,plants have evolved to reflect as much infrared light as they can. Infrared light is reflected more from healthy leaves than stressed or dead leaves. NDVI calculation ranges from -1.0 to 1.0 in which:
- -1 to 0 being dead plants or inanimate object like soil rock, etc.
- 0 to 0.33 being unhealthy plants.
- 0.33 –0.66 being moderately heathy plants
- 0.66 –1 being very healthy plants
How do you calculate NDVI? #
Healthy plants reflect more near-infrared light (NIR) and green light compared to other wavelengths, but it absorbs more blue light.
Chlorophyll is found in virtually all photosynthetic organisms, including plants and it does not absorb green light, that is why plants are green in colour.
The formula for calculating NDVI is:
Formula to calculate NDVI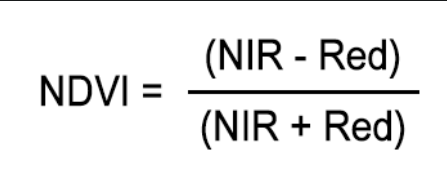
The result of this formula generated a value between -1 and +1, Overall, NDVI is a standardized way to measure the health of plants, the higher the value the healthier the plant.
I use the Pi NoIR camera to capture and calculate NDVI images the NoIR camera has a blue filter instead of a red one so Instead of subtracting the red channel from the image, we subtract the blue. The infrared image captured form the Pi NoIR camera is then processed via raspberry pi using open cv, which first calculates NDVI then applies a color map to the calcualted results which gives revelant information at a glance.
I’ve also used temperature, humidity, light and soil moisture sensors attached to an Arduino uno (which serially communicates the data to raspberry pi) to determine what is wrong when the plant health goes below 0.33.
This is an example of how the image looks after calculation of NDVI:
NDVI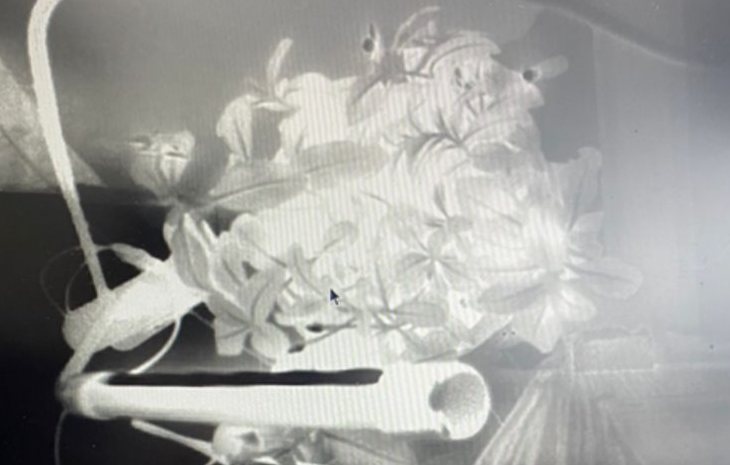
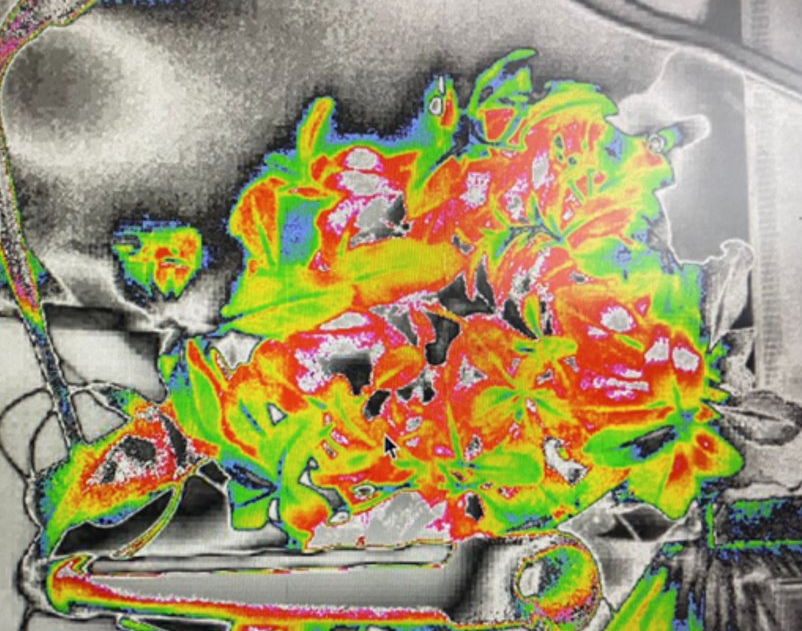
And how the image looks like after I’ve applied a colour map:
Colour mapped image